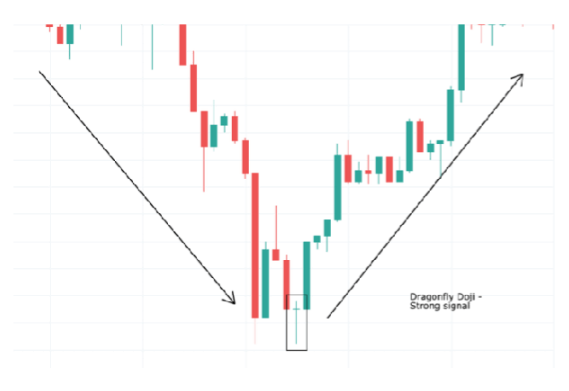
When does a Dragonfly Doji show up?
The Dragonfly Doji is an alternating candlestick pattern with minimal body and no upper or lower shadows. The real significance of a Doji is indicated by the position of the Doji bar concerning previous market action. The Doji is often a reversal pattern, which appears in the middle of a trend, therefore, it can be considered an indicator of whether or not a trend will continue.
Another interesting aspect of the doji is that it does not show any meaningful signal when looking at its appearance. Since there are no upper and lower shadows, the appearance of a doji indicates that there were two price extremes during the trading session. The price may have been positive or negative at those two extremes. You’ll want to look at the previous bars to determine where the doji falls about the prevailing trend. If two or more dojis appear consecutively, it can be considered a Doji Star candlestick pattern, a trend reversal signal.
The doji is also an indicator of long-term trends, and it can be trusted to indicate which direction a market will take for a long period. If it appears near the bottom of a downtrend, then any reversal from that point forward would mean that the downtrend has exhausted its momentum. However, if that momentum is now going to reverse back in favour of the market. If the doji is at the top of an uptrend, then the market will start weakening and reversing back down.
How to identify a Dragonfly Doji
The appearance of a doji is not challenging to identify. It’s a critical candlestick pattern, but it is usually confused with other patterns that have similar appearances. The defining characteristic of a doji is that it shows no upper and lower shadows; therefore, the body will be roughly the same size as the candlestick’s “real body”. There will be no partial real body and no shadows at all. The upper and lower bounds for the stock’s price range will be roughly equal on both sides of the candlestick.
The colour of the bar isn’t significant. It can be black or white, and its relative strength within the context of a greater downtrend or uptrend will determine whether or not it’s a reversal of that trend.
Additional information
There are quite a few candlestick patterns that can be confused with a doji. The following list includes the most common patterns that can be confused with a dragonfly Doji. Its confusion is easy to understand; most of these other candlestick patterns have nothing to distinguish them from the doji, so the difference depends on the context in which they appear.
Wolf Doji: In this case, the real body is roughly the same size as the candlestick’s “real body”
Lengthwise Doji: This type of candlestick pattern has a long upper tail with no lower tail. That means that the real body will be roughly equal in length to the candlestick’s “real body”.
Shaven Bottom: This is the inverse of the Doji Star, where the doji appears in a downtrend, and then a larger real body completes the pattern. In this case, there are small shadows on both sides of the candle.
Long-legged Doji: This doji has long shadows on both sides and no real body. The colour of the bar is irrelevant to this pattern.
Hammer: The hammer has small shadows on both sides and a long real body.
Bailey: This is a candlestick with a long real body with no shadows and no long upper tail.
Squat Doji: This type of doji has shadows on both sides, and then the real body is very short. The colour of the bar is irrelevant to this pattern.
The Importance of the Doji
You may wonder why you should even bother with this type of candlestick pattern or its significance. After all, the doji is a relatively unusual candlestick pattern, and it’s not as widely recognised as some of the other patterns regularly discussed in technical analysis courses.
The doji is a very significant pattern. It’s not just that; it’s also a reliable indicator for a trend reversal. If you use it in conjunction with other indicators and technical analysis patterns, you can gain an edge over the competition and increase your chances of making a profit. While it would be ideal for you to study this pattern in more detail by using the other tools at your disposal, such as candlestick charting software, those tools are difficult to learn and use. As you may have already noticed, the pattern itself is relatively simple and can be seen on any charting software with Japanese candlestick patterns.
Your best bet is to memorise the appearance of the doji since it will appear in different contexts. The appearance of a doji might not tell you much about what will happen next in the market, but it does allow you to determine where it falls within the context of a market’s movement.
Conclusion
The doji is used for many types of technical analysis, but it’s most commonly used for predicting trends. This candlestick pattern can determine whether a trend will continue or reverse. Since the doji is an indecisive candle, it will tell you that there were two price extremes during the trading session and that no new trend was established that day. The next candlestick will determine which way the market will go.


