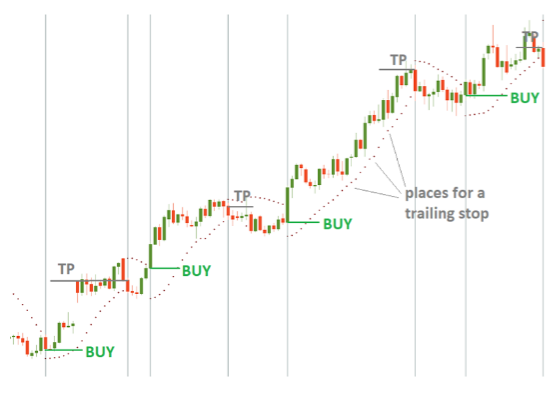
Why it is one of the most preferred by analysts
1. It avoids the pitfalls of traditional trend-following strategies
A common trend-following strategy uses a moving average for the signal, the indicator which predicts whether the market will rise or fall, and then a different moving average for the target.
Use an expensive moving average like an exponential or simple moving average. You must buy or sell on divergent signals, leaving little room to hedge as your trade goes against your position in the longer-term trend. In contrast, you can use one simple moving average to predict a movement and adjust your role in that trend with the Parabolic SAR.
2. It avoids complexity traps
Another common trend-following technique requires you to buy or sell on the close of a series of higher or lower price bars, which creates a problem when prices move quickly. It can lead to examples such as reversing signals, where the market changes direction, and you end up unhedged and heavily out-of-position for one or more stages of the trend. You have one indicator that only changes when there is a price change, so no problem here either.
3. It lessens the need for trading signals
Investment professionals often provide trading signal sets and are designed to allow the user to trade particular market conditions. These can be useful, but they can also create confusion and financial risk. With the SAR, there is no need for any trading signal. One can use the indicator to get a sense of what is happening in the market, but it cannot predict the future trade direction.
4. The Parabolic SAR fosters opportunistic trading
Traditional trend-following strategies are based on a trend-following or position-following strategy. This approach calls for waiting for trends to develop to a particular stage before initiating trades. With the SAR, you have an indicator that will let you know whether enough trends are in place to allow you to profit from them and let you know when something changes to adjust your position accordingly.
5. It is easy to manage
With it, you can have the market tell you where it is going, what it will take to get there, and still not be kept on a leash by analysts' signals. It is almost like having an analyst with you every step to help you understand what's happening in the markets. It gives you a better chance of beating your competitors and making money than traditional trend-following strategies.
6. It helps guide trading decisions when markets move too quickly to follow traditional trend-following strategies
When markets move too quickly, there are only a few ways to catch trades. The SAR can help you identify the opportunities and evaluate them concerning available funds, risk tolerance, and other factors.
7. One can use it in all periods and market conditions
It has a long history of success in use on all the major market timeframes, including the daily, weekly, and monthly charts and intraday trading. It is excellent for traders who want to be in the market when the trend occurs.
8. It is easy to understand and incorporate into existing trading strategies
The concept behind the indicator is not that hard to understand; anyone who wants to try it out should have no trouble getting it. Further, one can easily incorporate the indicator into trading strategies that use other indicators.
9. It is a cost-effective way to improve market insight
It is relatively inexpensive and can be used on one or more trades at a time, so it's ideal for trading smaller accounts and portfolios. Plus, it requires little maintenance once you know how to use it effectively.
10. It is easy to incorporate into the existing methodology
Traders familiar with traditional trend-following strategies will quickly understand how to incorporate the SAR into their approach because of its similarities to other trend-following strategies.
What happens if the price you use as a baseline is too volatile?
If you use historical volatility to calculate your SAR and use the daily chart, it will react to additional volatility in the trend. If this further volatility is caused by an unexpected event such as a merger announcement or upcoming earnings report, the SAR will absorb some of that excess volatility. If the market has a natural move that doesn't have any real news but has more than average intraday price volatility, then the arrows will also absorb this. The arrows will come back to the baseline price level but will rise again, likely overshooting the original middle line as they return.
If you are using NASDAQ or NYSE TICK Data, then it can react to a single intraday significant move. If this move is caused by an unexpected event such as a merger announcement or upcoming earnings report, the SAR will absorb some excess volatility. If the market has a natural move that doesn't have any real news but has more than average intraday price volatility, then the arrows will also absorb this.
Conclusion
The Parabolic SAR is a handy trend-following indicator for traders. You will be able to see and monitor the market trend in real-time so that you can make timely decisions about your trades. You will also be able to adjust your trading positions and reduce risk if the trend gets out of control. It also makes it easier to stop being a victim and take charge of your trading.


